Pipeline Metrics
This page shows you how to export metrics from a Kubeflow Pipelines component. For details about how to build a component, see the guide to building your own component.
Overview of metrics
Kubeflow Pipelines supports the export of scalar metrics. You can write a list of metrics to a local file to describe the performance of the model. The pipeline agent uploads the local file as your run-time metrics. You can view the uploaded metrics as a visualization in the Runs page for a particular experiment in the Kubeflow Pipelines UI.
Export the metrics dictionary
To enable metrics, your component must have an output called MLPipeline Metrics and return a JSON-serialized metrics dictionary.
Otherwise the Kubeflow Pipelines UI will
not render the visualization. In other words, the .outputs.artifacts setting
for the generated pipeline template should show:
- {name: mlpipeline-metrics, path: /tmp/outputs/mlpipeline_metrics/data}.
(The file path does not matter.)
An example Lightweight python component that outputs metrics dictionary by writing it to an output file:
from kfp.components import InputPath, OutputPath, create_component_from_func

def produce_metrics(
  # Note when the `create_component_from_func` method converts the function to a component, the function parameter "mlpipeline_metrics_path" becomes an output with name "mlpipeline_metrics" which is the correct name for metrics output.
  mlpipeline_metrics_path: OutputPath('Metrics'),
):
  import json

  accuracy = 0.9
  metrics = {
    'metrics': [{
      'name': 'accuracy-score', # The name of the metric. Visualized as the column name in the runs table.
      'numberValue':  accuracy, # The value of the metric. Must be a numeric value.
      'format': "PERCENTAGE",   # The optional format of the metric. Supported values are "RAW" (displayed in raw format) and "PERCENTAGE" (displayed in percentage format).
    }]
  }
  with open(mlpipeline_metrics_path, 'w') as f:
    json.dump(metrics, f)

produce_metrics_op = create_component_from_func(
    produce_metrics,
    base_image='python:3.7',
    packages_to_install=[],
    output_component_file='component.yaml',
)
Here’s an example of a lightweight Python component that outputs a metrics dictionary by returning it from the function:
from typing import NamedTuple
from kfp.components import InputPath, OutputPath, create_component_from_func

def produce_metrics() -> NamedTuple('Outputs', [
  ('mlpipeline_metrics', 'Metrics'),
]):
  import json

  accuracy = 0.9
  metrics = {
    'metrics': [{
      'name': 'accuracy-score', # The name of the metric. Visualized as the column name in the runs table.
      'numberValue':  accuracy, # The value of the metric. Must be a numeric value.
      'format': "PERCENTAGE",   # The optional format of the metric. Supported values are "RAW" (displayed in raw format) and "PERCENTAGE" (displayed in percentage format).
    }]
  }
  return [json.dumps(metrics)]

produce_metrics_op = create_component_from_func(
    produce_metrics,
    base_image='python:3.7',
    packages_to_install=[],
    output_component_file='component.yaml',
)
An example script-based component.yaml component:
name: Produce metrics
outputs:
- {name: MLPipeline Metrics, type: Metrics}
implementation:
  container:
    image: alpine
    command:
    - sh
    - -exc
    - |
      output_metrics_path=$0
      mkdir -p "$(dirname "$output_metrics_path")"
      echo '{
        "metrics": [{
          "name": "accuracy-score",
          "numberValue": 0.8,
          "format": "PERCENTAGE"
        }]
      }' > "$output_metrics_path"
    - {outputPath: MLPipeline Metrics}
Refer to the full example of a component that generates a confusion matrix data from prediction results.
-
The output name must be
MLPipeline MetricsorMLPipeline_Metrics(case does not matter). -
The
nameof each metric must match the following pattern:^[a-zA-Z]([-_a-zA-Z0-9]{0,62}[a-zA-Z0-9])?$.For Kubeflow Pipelines version 0.5.1 or earlier, name must match the following pattern
^[a-z]([-a-z0-9]{0,62}[a-z0-9])?$ -
numberValuemust be a numeric value. -
formatcan only bePERCENTAGE,RAW, or not set.
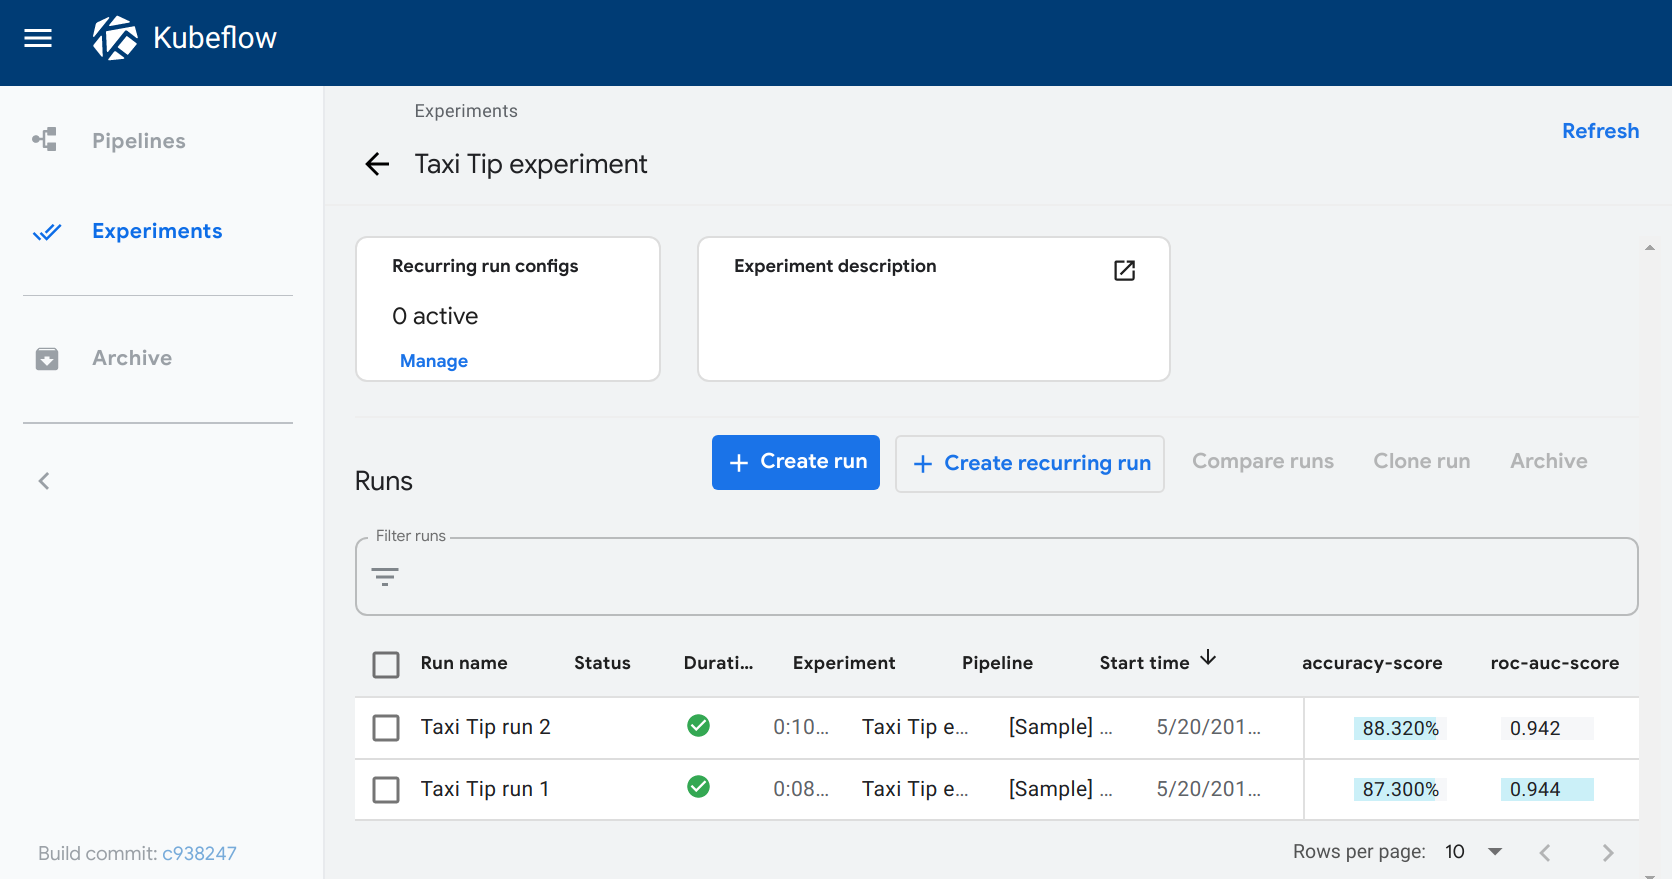
View the metrics
To see a visualization of the metrics:
- Open the Experiments page in the Kubeflow Pipelines UI.
- Click one of your experiments. The Runs page opens showing the top two metrics, where top is determined by prevalence (that is, the metrics with the highest count) and then by metric name. The metrics appear as columns for each run.
The following example shows the accuracy-score and roc-auc-score metrics for two runs within an experiment:
Next step
Visualize the output of your component by writing out metadata for an output viewer.
Feedback
Was this page helpful?
Glad to hear it! Please tell us how we can improve.
Sorry to hear that. Please tell us how we can improve.